In the first week of learning about Google Analytics I thought I was making good progress. I thought “this is easy, it’s all about seeing how many people visit your website” and assumed I would have mastered the whole discipline of web analytics in no time. But by the second week I had realised just how much there was to learn.
It’s been a few months since I started on that journey and since then I have managed to complete the Google Analytics fundamentals training course, read hundreds of pages of help sheets, and watched countless videos. I am still nowhere near truly understanding Analytics, but I have learnt one key thing: It’s not all about the numbers of people who visit your website, there a whole range of useful things you can do with the data.
What is Google Analytics?
Google Analytics is web analytics software from Google which, in its most basic form, allows you to track how many people come to your website and work out whether different advertising campaigns increased your visitor numbers.
The basic features include things like:
- Numbers of page views
- Geographic visitor information
- Details of the hardware and software your visitors use to access your site
- Whether they came via organic searches, links from other websites or pay per click adverts.
This gives you a general insight into who visits your site and how they got there.
More advanced features allow you to view the behaviour of your site visitors:
- Tracking how long they stay on your site for
- How many and which pages they visit
- What they actually do on those pages
This can provide you with actionable insights ie., intelligence and conclusions that you can confidentally make plans from. For example, if you have a page with a high bounce rate, you can investigate why and then either fix or remove the page if it can not be improved.
Tracking codes
Inserting tracking code is the first thing you need to do when starting Google Analytics.They are pieces of Javascript that need to be written into the code of the website before you can start with Google Analytics; without tracking codes you have no data. The JavaScript is very basic to begin with however for ecommerce and event tracking the JavaScript will get more complicated
Filtering out IP addresses
The graphs the Google Analytics puts out are only going to be as reliable as the data that goes in. If you and your colleagues are visiting your own website Analytics you will track your movements and actions on the website, which will affect the reliability of your results. If you visit your own website regularly and behave differently to your target market – which is quite likely – then this could give you some seriously inaccurate data.
To prevent this, the first thing you should do when setting up Google Analytics is to set up a second view and filter out your office’s static IP addresses and any other IP addresses you may access the site from. The easy way to do this is to go into Admin and then Filters; from here you can add a filter to exclude traffic from your chosen IP addresses. The reason for setting up a second view is security. If something goes wrong with the second view – like the wrong IP addresses being filtered out – you will still have some meaningful data. 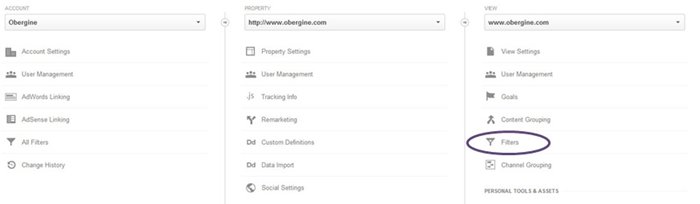
How to find useful data
I assumed that setting up Google Analytics would simply be a case of putting a bit of code on your website, then sitting back and waiting for the data.
I was wrong.
Not completely wrong: you could do this if you simply wanted to view visitor numbers. But apart from this the data you would receive would be of minimal use if not viewed properly and, depending on the layout of the site, could provide confusing information. The easiest way to find the data that you need is through reports.
There are five high level reports and from these the most useful data will come from:
- Audience: This gives you demographic and geographic information about who visits your site
- Acquisition: Shows you how traffic has arrived at your site
- Behaviour: Informs you what visitors do when they are on your site and duration information
All three of these sections have an overview option which provides you with what Google has chosen to be the key information, but if you drill down a bit further you can easily see detailed useful information.
Audience reports
In Audience, one of the most useful views is Visitor Flow. This is an illustrated graphic showing where people start their journey on your website, which pages they visit while they are exploring your website, and the last page they viewed before leaving the site. This can be used to easily identify pages that have high exit or bounce rates.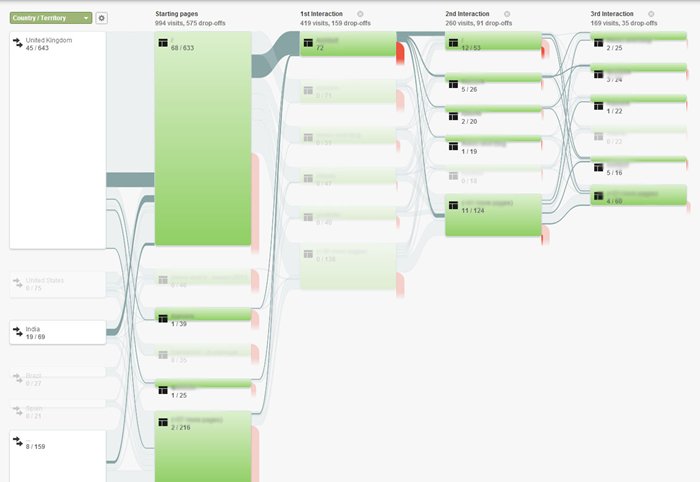
The Frequency and Recency view is another which is extremely useful when just beginning with Google Analytics. It allows you to see a frequency distribution of how often people return to your site, so whether they are likely to visit once, twice or twenty times in a period of time.
If someone visits your site a number of times in a month it would suggest that you are engaging them well and it allows you to set goals for your content. If you were running a newspaper, for example, you would want to encourage people to visit multiple times per day, but if you have a blog that is updated weekly you might want your subscribers to come back every week.
Behaviour reports
Another really useful view is Landing Pages, which is located under the Behaviour tab. This allows you to see which page people enter your site on; you would expect the page attracting the most traffic to be your homepage, but sometimes this might not be the case. If you have a popular blog post that is being actively shared this might get a higher proportion of traffic.
Analysing your Landing Page information is useful for finding out which of your campaigns or blog posts have been bringing in engaged visitors. If they are bringing in lots of traffic then Google Analytics can tell you what changes might be needed to ensure they work harder for your business, such as adding a Call to Action buttons taking visitors to relevant product pages or encouraging them to sign up for a free ebook.
Acquisition reports
The Channels view is the page that I find the most useful in Acquisitions. It allows you to easily see which channel your traffic has a arrived from. Some of the channels include Organic search, Direct, Referral, Social and Other. From this you can explore each channel further, for example from Social you can then view which social channels such as Twitter, Facebook, LinkedIn etc. From this you can determine which channel works best for you and which channels need more work.
Linking Webmaster Tools to Google Analytics
Over the last couple of years Google has been giving people more privacy when they use Google’s services. One of the big results of this for SEOs and digital marketers has been that Google doesn’t pass data about what people search for to analytics platforms if those people either log in to their Google account or opt out of data sharing – and that includes not passing data into Google Analytics. With the proportion of searches being lumped into the (not provided) bucket increasing to almost 100% for some people, the Organic Keywords report isn’t very useful any more. This is where Google Webmaster Tools (GWT) comes in.
GWT shows you how many impressions your site has received in Google over the past ninety days and how many clicks, and you can see this data in Google Analytics if you link the two. This helps you to get some of your data back to measure your SEO success and work out what queries are bringing people to your site so you can target them better
The future
While this post covers a lot of ground there is even more that Google Analytics can do for you. The only problem is, this stuff doesn’t come out of the box. For the next post in this series I’m going to look at how customising Google Analytics can help you to get deeper insights than the standard reports will ever give you. Stay tuned!