Communication is a funny thing. It’s something that a number of agencies, and we’re no exception, say that they’re great at. Communicating lots is a good thing. It helps everybody, clients and project team, know where everybody else is, what they’re doing, and the direction we’re all moving in. A lack of communication can be a real pain and wreck projects; every root cause analysis I’ve ever done or been part of has found a lack of communication to be the real cause of the problem (or training, but at the end of the day that’s just a type of communication).
But too much communication can also be a pain. Meetings that go on forever because people want to discuss every tiny point; your boss walking over to have a chat when you’re in the middle of a string of complex budget calculations; people calling you five minutes after you get their email “just to check you got it”. Those kinds of interruptions can really ruin people’s flow, so you want to get rid of as many of them as possible. But at the same time, you want people to communicate as much as possible because that’s what keeps projects on track.
That gives all the Project Managers out there – including me - a big conundrum: how do we make sure everybody knows as much as possible about every project without people interrupting the project team to ask them questions? The answer is an information radiator.
What is an Information Radiator?
An information radiator is a large, highly visible display board that shows anybody walking past the vital information they need to know. Because of this they’re known as Big Visible Charts (BVCs), especially in software circles. A good information radiator:
- Is highly visible. Your boss can see it before she gets to your desk. Your boss’s boss can see it before he gets to her desk. Your clients can see it when they come in for meetings
- Is understood at a glance. Not only can your boss see it, but they can get useful information from it while distracted by the client on the other end of the phone line
- Changes regularly. Not only does this make it more interesting for a casual observer, it also makes it useful.
- Is easily kept up to date. Because if it isn’t easy and intuitive, people will stop updating it
- Beyond that, there are really no hard-and-fast rules. Each company – maybe even each team – has their own way of doing things:
- Agile teams might use a whiteboard showing their burndown charts, story point accumulations, and current iteration status.
- The government’s online editorial team use a digital information radiator to let everybody know what has been recently published and another team uses one to monitor the applications that keep their services running.
- Kanban boards are very common in manufacturing, and they are a type of information radiator.
- The company lobby at Panic in Portland, OR has a TV on the wall showing what everybody is working on, time to next release, when the next busses at the nearest bus stops are, and who’s in meetings that day
I’ve even heard of development teams using audio information radiators that play The Imperial March when a server crashes and Party Like It’s 1999 when a release goes live to let everybody in the company know the state of the product.
The point is they help people get information that is useful to them at that time and in that place, without the need to interrupt anybody.
Starting on the Journey
We could have spent days planning this project. We could have surveyed the team and found out what they think the most important information to communicate is; I could have taken the traditional PM role and written a specification document outlining everything the board needs to do and how it should do it; we could have had meetings about whether it should be a blackboard or a whiteboard, digital or not. But we wanted to keep this project as short and light as possible (so that we would have time to write blog posts about it).
My favourite way of tackling a complex problem is to jump in and explore it, then take a step back and map out what I have found out before plunging back in to solve it. Low-fi prototypes are a great way of doing that for even the most high-tech and complex of problems – if you don’t believe me have a look at how Google built the first Glass prototype with a coat hanger. So that’s exactly the approach we took here.
To get us on our way, rapid prototypes were needed. There was no point in thinking about materials or even the “digital or not?” question before some even more fundamental questions were answered:
- Who is going to be looking at this board?
- What do they want to know?
- How can we communicate that as simply as possible?
- Rapid prototypes would help us ask and answer those questions.
Prototype 1: A Process-Driven Board
Our idea was that the people looking at the board would be people outside the core development team, including the project managers. Their most often asked questions are along the lines of “where are we with this project” and “what are you working on today” so this is the information that needs to be communicated at a glance. But it would also be rather useful for the team to know what our next projects are going to be and when they’re going to start interfering with current work need their attention. Our first prototype, made in about ten minutes, looked like this.
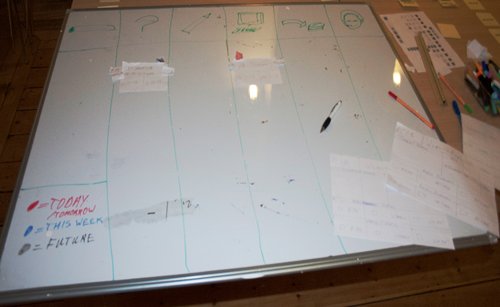
We used icons at the top for each stage of the process a piece of work goes through: pipeline, define, design, develop, deploy, support. A card with the project name on it very easily asks the question of “where are we with this project?” A start date and an end date hand written onto the card gives us more useful information at a glance– especially if we use a colour code to say that:
- Red means due today/tomorrow
- Blue means due this week
- Black means in the future
Here’s something else powerful about the information radiator – it tells the team what the most pressing tasks are, so they can choose to tackle them first. Some markers with our initials on them could tell everyone that we are responsible for progressing that project through that phase. The cards were made of paper, since it’s cheap and we found some in the stationary cupboard.
That’s a lot of questions answered with a few lines on a whiteboard, a piece of paper, and some lateral thinking.
Prototype 2: The Agile Model
I’m quite a fan of Agile project management techniques, so as part of this process I’ve been doing some research on how other Agile teams use information radiators. One version I found that was rather interesting described a board for a single project. It contained information on the current iteration, the current release, and the project overall.
We deal with multiple projects and tend to use a more traditional process than Agile, but we could see how this card could be useful. So our second prototype consisted of this card, which took its inspiration from the Agile information radiator.
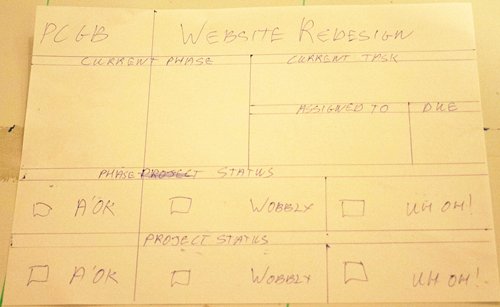
The idea was to have a board covered in these cards ordered by priority. We could put a big icon in the Current Phase box, and a traffic light system to show project and phase status. On the back of the card there is space for us to write the start dates and end dates (scheduled and actual) for each stage, so if somebody wants more information on how the project is progressing they can flip the card over and have a look.
Prototype 3: A Hybrid
The Agile card held much more useful information that our original card, but there was a problem: even if we used icons, putting a few of them together would make it difficult to work out how many projects were at each stage of the delivery process. So our final prototype board was a hybrid of the previous two. It has lanes for each part of the process, with Development being split down further into Front End and Back End and Deployment being split into Testing and Go-Live.
The final card looked like this one, with elements taken from the Agile card, like the Project and Phase status, but is a bit simpler and so easier to understand at a glance. Moving a marker at the top of the card allows us to show whether the next step is with us or the client, while the back of the card shows which milestones have been hit and when, in case somebody is interested in that information (which we all will be at the end of the project).
Importantly for me as the PM, this approach is easily extensible into a full-blown kanban board if we decide to go that way and it could be used as the focal point for a daily stand-up.
Next Step
Now that we have our prototyped information radiator, our next step is to work out what to build it in. We have a few ideas about that, which we’ll reveal in the next post.